The Sophos Active Adversary Report – Sophos News
It’s not news that 2024 has been a tumultuous year on many fronts. For our second Active Adversary Report of 2024, we’re looking specifically at patterns and developments we noted during the first half of the year (1H24). Though the year itself was in many ways unremarkable on the surface for those charged with the security of small- and medium-scale enterprises – the war between attackers and defenders raged on, as ever – we see some remarkable activity just below that surface.
Key takeaways
- Abuse of built-in Microsoft services (LOLbins) is up — way up
- RDP abuse continues rampant, with a twist
- The ransomware scene: Banyans vs poplars
Where the data comes from
The data for this report is drawn from cases handled in the first half of 2024 by a) our external-facing IR team and b) the response team that handles critical cases occurring among our Managed Detection and Response (MDR) customers. Where appropriate, we compare findings from the 190 cases selected for this report with data amassed from previous Sophos X-Ops casework, stretching back to the launch of our Incident Response (IR) service in 2020.
For this report, 80 percent of the dataset was derived from organizations with fewer than 1000 employees. This is lower than the 88 percent in our last report; the difference is primarily (but not entirely) due to the addition of MDR’s cases to the mix. Just under half (48%) of organizations requiring our assistance have 250 employees or fewer.
And what do these organizations do? As has been the case in our Active Adversary Reports since we began issuing them in 2021, the manufacturing sector was the most likely to request Sophos X-Ops response services, though the percentage of customers hailing from Manufacturing is down sharply, from 25 percent in 2023 to 14 percent in the first half of 2024. Construction (10%), Education (8%), Information Technology (8%), and Healthcare (7%) round out the top five. In total, 29 different industry sectors are represented in this dataset. Further notes on the data and methodology used to select cases for this report can be found in the Appendix.
The balance of the report analyzes our findings, as listed in the key takeaways above, and provides updates on a selection of issues raised by previous editions of the report. Analysis of the full dataset for 2024 will be undertaken in the next edition of the report, slated for early 2025.
Born to run (natively): LOLbin use on a rapid rise
LOLbins – abused-but-legitimate binaries already present on the machine or commonly downloaded from legitimate sources associated with the OS – have always been part of the Active Adversary landscape. We contrast these to the findings we call “artifacts,” which are third-party packages brought onto the system illegitimately by attackers (e.g., mimikatz, Cobalt Strike, AnyDesk). LOLbins are legitimate files, they are signed, and when used in seemingly benign ways they are less likely to draw a system administrator’s attention.
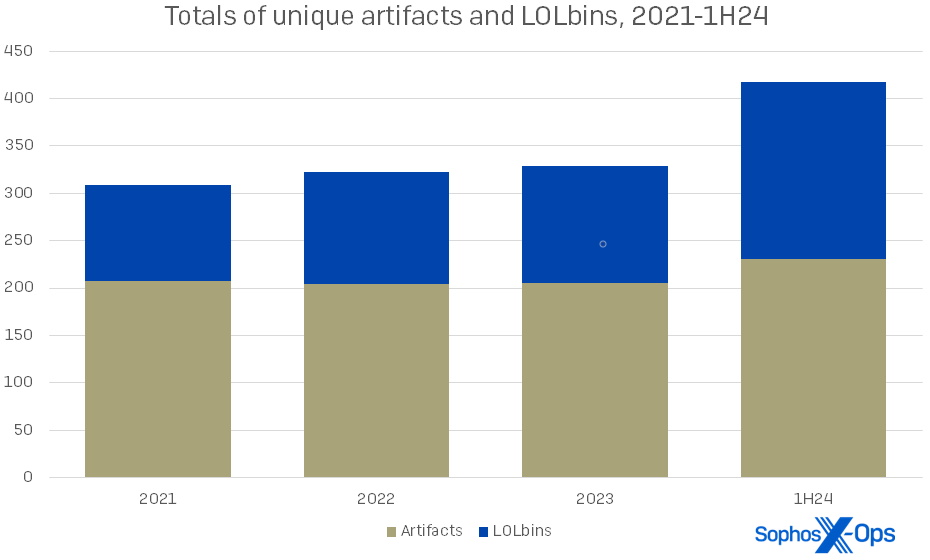
We saw a modest increase this year in the use and variety of artifacts, and we will look at those changes later in this report. The rise in LOLbins, however, is arresting. (For the purposes of this edition of the report, we are mainly focusing on binaries in the Microsoft Windows operating system, though we also see these abused in other OSes.) In the first half of 2024, we found 187 unique Microsoft LOLbins used among our 190 cases – over a third of them (64) appearing just once in our dataset. This represents a rise of 51 percent over 2023’s LOLbin numbers. The overall rise in LOLbin counts since 2021 is shown in Figure 1.
Figure 1: The abrupt rise in LOLbin use in 1H24 comes after years of slow increase in usage
Just three years ago, our 2021 statistics showed that artifacts were more than twice as common as LOLbins in our cases. Now the ratio is closer to 5:4, as shown in Figure 2.
Figure 2: The use of both artifacts and LOLbins is increasing overall, and attackers are throwing more of both at the wall to see what sticks. In a particular incident this year, the responding team noted 14 artifacts and 39 LOLbins in play
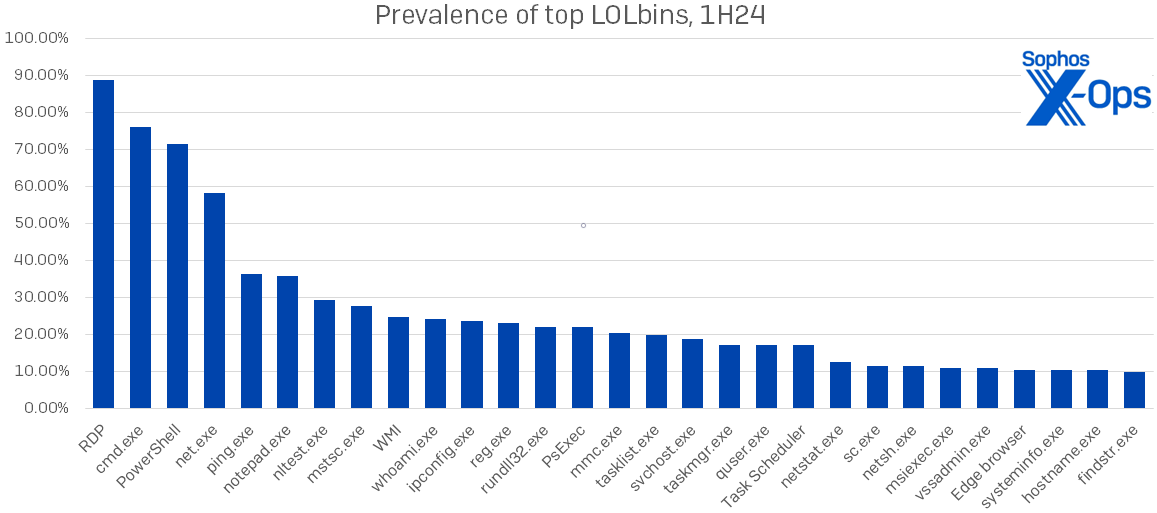
Which LOLbins are attackers using? Leading the pack as always is RDP, about which we’ll have more to say in the next section. We found 29 specific LOLbins in use in at least 10 percent of cases; their names and prevalence are shown in Figure 3. This represents a substantial increase over last year’s distribution, where only 15 of the 124 unique LOLbins spotted appeared in over 10 percent of cases.
Figure 3: The most commonly logged LOLbins of 1H24; all of these appeared in at least 10 percent of cases
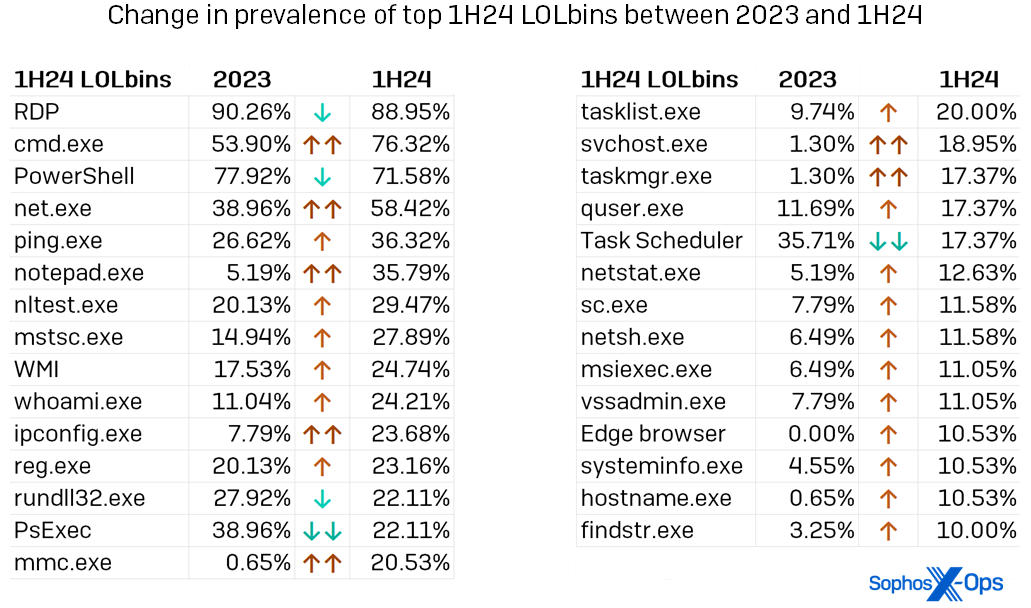
For the most part the names in the figure above are no surprise to regular readers of the Active Adversary Report – RDP rules the landscape, with cmd.exe, PowerShell, and net.exe making their usual strong showing. However, we can see increased use of even some of those familiar LOLbins in Figure 4, which also shows the percentage increase in usage for every LOLbin seen in over 10 percent of 1H24 cases. Note the prevalence of binaries used for discovery or enumeration – 16, by our count.
Figure 4: Of the top 29 LOLbins we saw in use during 1H24, only five were observed less frequently than they were in 2023. (LOLbins for which usage changed substantially – either 15 percent higher or lower than in the previous year’s data – are indicated above with double arrows). Please note that in the context of this list, “Task Scheduler” includes both Task Scheduler and schtasks.exe, while WMI includes the now-deprecated WMIC
What’s a defender to do? First, this change in tooling means that it isn’t enough to just keep an eye on your network for items that don’t belong. Every LOLbin is in some way part of the operating system, from RDP down to fondue.exe, tracert.exe, and time.exe (three of the one-use-only LOLbins we spotted in the data). More than ever, it’s crucial to understand who’s on your network and what they should be doing. If Alice and Bob from IT are doing things with PowerShell, probably okay. If Mallory from PR is doing things with PowerShell, ask questions.
In addition, logging and well-informed network monitoring are key. At one point in our analysis we asked ourselves whether the increases we were seeing were perhaps merely the result of incorporating the data from our MDR team. After normalizing the data we were able to conclude that they’re not, but we were once again startled by the difference having MDR-type eyes on the system makes when it comes to both initial access and impact. (More on those in a minute.)
To learn more about LOLbins, including functions of individual binaries and where they (usually) fit into the MITRE ATT&CK framework, we recommend visiting the LOLBAS collaborative project on Github.
RDP (stands for Repeating the Damn Problem)
For a report that enjoys throwing in pop-music references, Active Adversary sounds like a broken record: RDP, RDP, RDP. As shown in the figures above, RDP is undefeated as a source of infosecurity woe, with just under 89 percent of the cases we saw in 1H24 showing some indication of RDP abuse.
Looking more closely at the cases involving RDP, there’s not much change in whether attacks used RDP internally or externally. These statistics have been stable over the years, as shown in Figure 5.
Figure 5: In 2022 and 2023, there were several cases in which attackers kicked over the traces of their RDP activity so thoroughly that the responding team could not confidently discern exactly which actions had been successful; 1H24 was better in that aspect at least
Looking just outside this report’s timeframe, the monotony of RDP abuse statistics was only slightly broken in September by Microsoft’s announcement that the company is rolling out a multiplatform “Windows App” (this is its name) designed to provide remote access to Windows 10 and 11 machines from “work or school accounts,” with RDP access promised later. However, despite the company’s claims of enhanced security including multifactor authentication capability, most observers were quick to describe Windows App as primarily a rebrand of the Remote Desktop client. Whether our next Active Adversary Report has happy news of a drop in RDP abuse or not, only time will tell.
Shaking the tree: The poplars and banyans of ransomware
Turning our attention now to ransomware, a stroll through the data on ransomware infections led to an interesting observation: When it comes to attribution, the corollary between high-profile ransomware takedowns and diminished presence on our charts isn’t always as strong as one would hope.
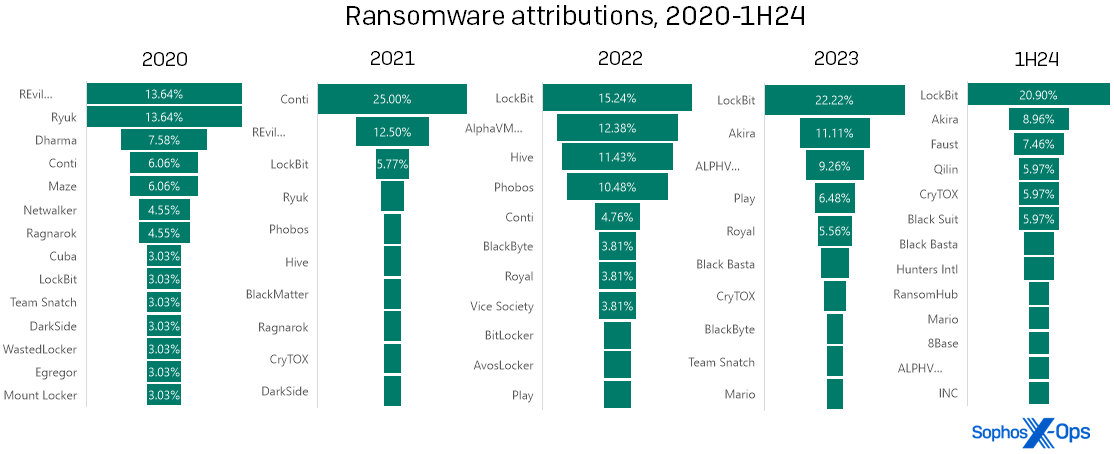
In our experience, some years have one dominant ransomware brand that overshadows the others like the canopy of a banyan tree, and other years distribute the ransomware cases relatively evenly among multiple brands, like a row of poplars. The difference generally corresponds with legal disruptions (“takedowns”) of high-profile ransomware groups. However, the first half of 2024 did not reflect this pattern in our data. LockBit was the dominant ransomware of 2023, but was the subject of a law-enforcement disruption in late February 2024. Despite that, LockBit remained the dominant ransomware seen by the IR team in the first half of the year.
Figure 6: Poplar, banyan, poplar, banyan… banyan?! The pattern we’ve observed in ransomware attributions over the past several years seems to have broken down in 1H24 with LockBit… maybe. (Two of the labels above are truncated for space; “REvil….” is more fully “REvil / Sodinokibi,” while “ALPHV….” is “ALPHV/BlackCat”)
To be fair, legal action ultimately doesn’t make a huge dent in the overall ransomware scene – it disrupts the targeted threat actor, but does not permanently stop most of the entities involved. With every major legal action, the sheer number of other brands jockeying for position means that the gap is filled, and then some. Notice that Conti represented a mere 6 percent of infections seen in 2020… and then first Ryuk (2020) and Revil (2021) were hit by takedowns of the gang or, in Ryuk’s case, the Trickbot distribution system on which it relied. After that Conti (likely descended from Ryuk) flourished for a year (2021), but dropped to single-digit occurrence levels by the end of 2022. In LockBit’s case, the proprietor of the brand attempted a mid-2024 “comeback,” rebuilding its infrastructure and even restarting its blog. (A version of LockBit’s ransomware builder was also famously leaked by a disgruntled associate in September 2022, which may affect its prevalence.)
What’s next? First, it is possible that the pattern will resolve itself in the data from the second half of the year – that is, the “banyan” will morph into a “poplar” as predicted. In the month or so after the LockBit takedown, Sophos’ MDR and IR teams, respondents to our 2024 State of Ransomware survey, and other industry observers all reported a decrease in LockBit infections. Those bounced up again for a while in May; it’s not unusual to see that sort of echo effect after a disruption by law enforcement, but eventually the echo does fade.
Second, the name of the next ubiquitous ransomware is probably somewhere in the figure above, which means that even if system administrators might not want to place bets on any particular brand, the culprit is likely already on defenders’ radar. Those looking to parry the next attack on their systems can start by keeping an eye on news concerning both known names and up-and-comers. It’s perfectly reasonable to celebrate that creatures like Mikhail Matveev and Ekaterina Zhdanova are facing jail time, but the song isn’t over.
Overall, ransomware infections were down slightly in the first half of the year. For IR, 61.54 percent of cases handled involved ransomware, compared to 70.13 percent in 2023. (The slack was more than taken up by network breaches, which nearly doubled their incidence in IR cases – 34.62 percent in 1H24, compared to 18.83 percent in 2023. Close examination of all data available to us causes us to suspect that the drop, though real, won’t be as pronounced when the full year’s numbers are analyzed.)
Meanwhile, MDR handled mainly network breaches in 1H24, with just 25.36 percent of their cases chalked up to ransomware. It should be noted that MDR, due to the nature of the service, tends to encounter and contain ransomware far earlier in its infection cycle than the IR team does – usually, prior to encryption or deployment, which means that they never rise to the level of requiring response of the sort the Active Adversary Report covers. (Unfortunately, “attack detected” for the IR team often means “the customer realized that they might be under attack when they received a ransom note and all their computers were bricked.”) For the MDR team, LockBit was already flattening out in prevalence by the end of June, with 17.14 percent of their ransomware attributions chalked up to that brand and both Akira and BlackSuit close on its heels at 11.43 percent apiece. (And completing the circle, both Akira and BlackSuit are descendants of… Conti. Same song, next verse.)
Comin’ in and out of your life: Initial access and impact
The third and fourteenth steps of the MITRE ATT&CK Matrix invariably attract reader interest; we have even written in a previous report about the differences we observed between two very similar cases handled by our IR and MDR processes. For this report, we’ll focus our MITRE-related analysis on the categories themselves, Initial Access and Impact.
Initial Access in the first half of 2024 looked much as it did in previous years. As one would expect from the RDP statistics, External Remote Services attack techniques ruled the category, representing 63.16 percent of cases compared to 2023’s 64.94 percent. Valid Accounts (59.47%, down from 61.04%) and Exploit [of] Public-facing Application (30%, up from 16.88%) round out the top three. (Since cases may exhibit many combinations of initial-access techniques, the percentages will never add up to 100.)
The situation is more interesting with Impact, the final category in the MITRE matrix. After years of dominating the Impact category by factoring into a minimum of two-thirds of all cases, Data Encrypted for Impact (a typical step in ransomware attacks) tumbles to second place with 31.58 percent, just above up-and-comer Data Manipulation (30%) and trailing No Impact at 38.95 percent.
We have written in the past about “No Impact” meaning something a bit different when it comes to ATT&CK. The latest edition of ATT&CK lists fourteen techniques that it recognizes as “Impact.” These techniques are evolving to keep pace with current realities of ransomware payouts and lost productivity, and we have refined our analysis of previous case data to reflect those improvements (thus retroactively trimming down the number of cases for which the impact finding is No). But it may be too much to ask that the ATT&CK category encompass intangibles such as reputational loss or staff burnout. Incident responders are all too aware that nobody wants to need their services; though “no” impact sounds refreshing and pleasant, and though many of the MDR-handled cases were indeed triggered in time to block would-be attackers from succeeding in their objectives, “No Impact” doesn’t mean there was no impact – it means that whatever happened is beyond ATT&CK’s vocabulary to describe.
Where are they now: Checking on previous AAR findings
In an attempt to keep this edition of the report relatively short, there are a few topics of previous interest on which we’ll touch briefly, in advance of our full-year 2024 report.
Dwell time: Dwell-time numbers have been dropping, as we showed in our first 2023 report. The 1H24 numbers indicate that this decline has leveled off or even slightly reversed for cases handled by our Incident Response team. For ransomware, median dwell times hover at 5.5 days; factoring in all other types of incidents, the median lingers at 8 days. Though we do not yet have previous years’ MDR cases available to the report team for analysis, a look at their 1H24 data shows what a difference monitoring makes – medians of 3 days for ransomware and one day for all types of incidents. Since the MDR cases requiring incident response are a very small sliver of all the activity MDR sees day-to-day, the effect of having watchful eyes in place is left as an exercise for the reader.
Time-to-AD: In our second 2023 report we looked at the time it takes for attackers to gain control of the target’s Active Directory — a point at which one can reasonably say that the target is compromised — and the interval from when the attacker gains control of AD to when the attack is detected. This is another statistic for which MDR’s data varies radically from that compiled by IR. The IR numbers fluctuated in 1H24 from those of years past, with attackers taking about two hours longer to reach Active Directory (15.35 hours in 2023, 17.21 hours in 1H24). An apparent decrease in dwell time between AD acquisition and attack detection (29.12 hours in 1H24, down from 48.43 hours in 2023) is interesting and may merit scrutiny in the next report, if a larger accumulation of data reveals it to be a real development.
We will note that the three versions of Active Directory we most frequently saw compromised were Server 2019 (43%), Server 2016 (26%), and Server 2012 (18%), together accounting for 87 percent of compromised AD servers. All three of these versions are now out of mainstream Microsoft support, even though Patch Tuesday release information still states which updates would apply to each version. If your systems are running on tired versions of Server, consider these numbers your wake-up call to update. (For those who follow our Patch Tuesday coverage, we have started this month to relay more information on precisely which versions of Server are affected by each month’s patches.)
Compromised credentials: We also spotlighted the rise in compromised credentials as a root cause of attacks in our second 2023 report. In 2023, 56 percent of all incidents had compromised credentials as their root cause. In the first half of 2024, that dominance was dialed back somewhat. Though compromised credentials were still the leading root cause overall for 2024, that number was led mainly by the IR cases, as shown in Figure 7. For MDR customers, exploited vulnerabilities led the root-cause leaderboard, though by less than one percent.
Figure 7: The root causes of IR-handled and MDR-handled incidents varied, with cases more equally distributed among MDR and compromised credentials “winning” in a walk for IR
Just a song about artifacts before I go
As mentioned above, our data found not only LOLbins but third-party artifacts on the rise in the cases we saw in the first half of 2024. The rise in artifact usage is not as striking as that of the LOLbins, but a few aspects bear further discussion.
First, the numbers are up, though slightly. We saw 230 unique artifacts on targeted systems in the first half of 2024, compared to 205 in all of 2023 – a 12 percent increase. (By way of comparison, 2022 had 204 artifacts; 2021 had 207.)
Second, the names of the most commonly found artifacts don’t much vary from year to year, as shown in Figure 8. We did note that Cobalt Strike usage continues the retreat it began in 2023, present in just 13.68 percent of infections in the first half. (In previous years, Cobalt Strike was at one point present in nearly half the cases, and it still sits atop the leaderboard of all-time artifact findings. Better defender detections for Cobalt Strike are likely leading to this drop.) 127 artifacts appear only once in the 1H24 data, which is less than 2023’s 102 single-use findings.
Figure 8: The years-long trend toward more diverse artifact use continues, with no single artifact occurring in more than 30 percent of cases in the first half of 2024
A defender learning that over half of all artifacts are single-use tools may perhaps despair of catching everything an attacker might throw at them. We would encourage that defender to look at the table above and remember that the supporting cast may change, but the “stars” of the Artifacts galaxy all shine on. The table above shows every artifact that appeared in over 10.00 percent of cases over the course of four years. Keeping a relentless eye out for these packages is both doable and useful. Consider developing and applying a default-block policy for applications on your systems; this requires a fair amount of work up front, but saves trouble as attackers expand their tool-usage repertoire.
Conclusion
It has been an extraordinary gift to the AAR analysis and writing team to see how the statistics changed as we incorporated the large tranche of data from Sophos X-Ops’ MDR group with the years-deep database from our IR colleagues. The process of interrogating the data led us to both remarkable landscape changes – who knew that LOLbins could be exciting? – and to patterns such as RDP abuse that remain resistant to best practices such as vigilant monitoring.
Above all, though, we remain bemused by the number of cases that hinged on fundamentals – not just the three immortalized in the Sophos “haiku”
but simple pattern awareness that might have prevented customers from ever becoming part of a dataset such as this. It’s our hope that a close, tight snapshot of the recent Active Adversary Report landscape aids practitioners to sharpen their focus on the fundamentals that can keep us all safer and more secure.
Acknowledgements
The authors wish to thank Chester Wisniewski, Anthony Bradshaw, and Matt Wixey for their contributions to the AAR process.
Appendix: Demographics and methodology
For this report, we focused on 190 cases that could be meaningfully parsed for useful information on the state of the adversary landscape as of the first half of 2024. Protecting the confidential relationship between Sophos and our customers is of course our first priority, and the data herein has been vetted at multiple stages during this process to ensure that no single customer is identifiable through this data – and that no single customer’s data skews the aggregate inappropriately. When in doubt about a specific case, we excluded that customer’s data from the dataset.
We should make mention of a multi-year case that involved our MDR team. That case, which involved nation-state activity in several locations, has been covered elsewhere as “Crimson Palace.” Though fascinating and in many ways a bellwether for specific attack tactics we’ve seen elsewhere since, it is in multiple ways such an outlier to the vast majority of the Active Adversary dataset that we’ve chosen to leave its numbers out of the report.
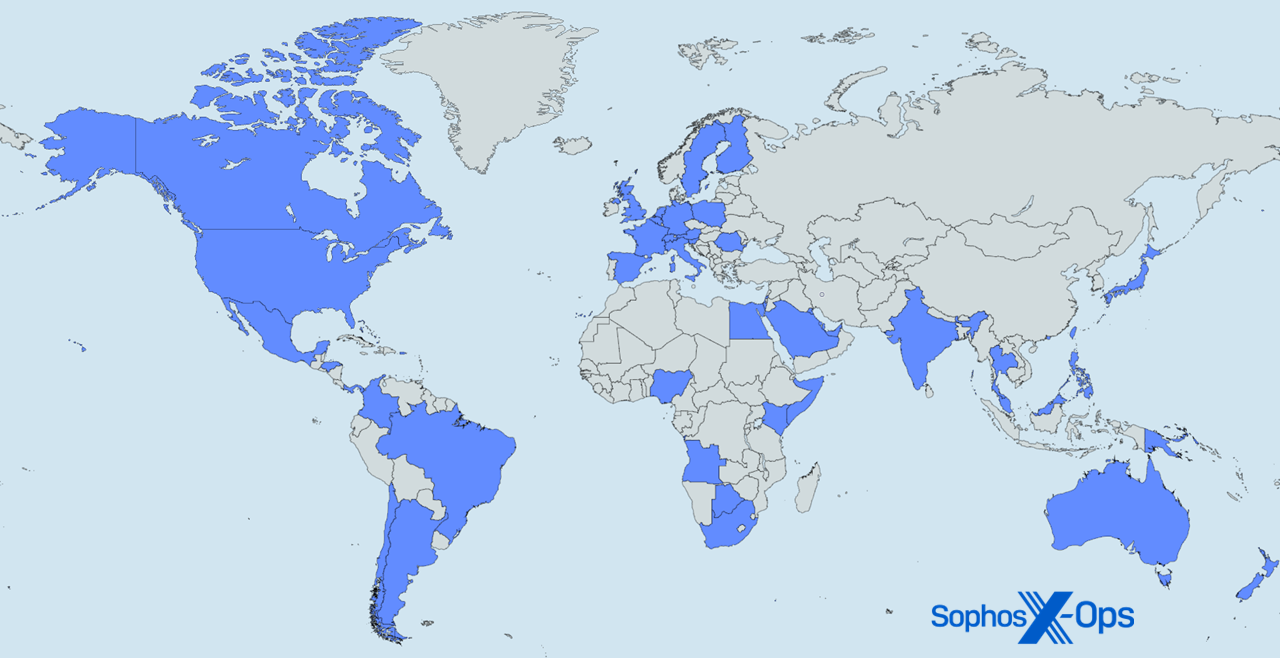
Figure A1: Here, there, and everywhere — it’s Sophos X-Ops MDR and IR around the world (Map generation courtesy mapchart.net)
The following 48 nations and other locations are represented in the 1H24 data analyzed for this report:
| Angola | Honduras | Poland |
| Argentina | Hong Kong | Qatar |
| Australia | India | Romania |
| Austria | Israel | Saudi Arabia |
| Bahamas | Italy | Singapore |
| Bahrain | Japan | Slovenia |
| Belgium | Kenya | Somalia |
| Botswana | Kuwait | South Africa |
| Brazil | Malaysia | Spain |
| Canada | Mexico | Sweden |
| Chile | Netherlands | Switzerland |
| Colombia | New Zealand | Taiwan |
| Egypt | Nigeria | Thailand |
| Finland | Panama | United Arab Emirates |
| France | Papua New Guinea | United Kingdom |
| Germany | Philippines | United States of America |
Industries
The following 29 industries are represented in the 1H24 data analyzed for this report:
| Advertising | Financial | MSP/Hosting |
| Agriculture | Food | Non-profit |
| Architecture | Government | Pharmaceutical |
| Communication | Healthcare | Real estate |
| Construction | Hospitality | Retail |
| Education | Information Technology | Services |
| Electronics | Legal | Transportation |
| Energy | Logistics | Utilities |
| Engineering | Manufacturing | Wholesale |
| Entertainment | Mining |
Methodology
The data in this report was captured over the course of individual investigations undertaken by Sophos’ X-Ops Incident Response and MDR teams. For this second report of 2024, we gathered case information on all investigations undertaken by the teams in the first half of the year and normalized it across 63 fields, examining each case to ensure that the data available was appropriate in detail and scope for aggregate reporting as defined by the focus of the proposed report. We further worked to normalize the data between our MDR and IR reporting processes.
When data was unclear or unavailable, the authors worked with individual IR and MDR case leads to clear up questions or confusion. Incidents that could not be clarified sufficiently for the purpose of the report, or about which we concluded that inclusion risked exposure or other potential harm to the Sophos-client relationship, were set aside. We then dissected each remaining case’s timeline to gain further clarity on such matters as initial ingress, dwell time, exfiltration, and so forth. We retained 190 cases, and those are the foundation of the report.
